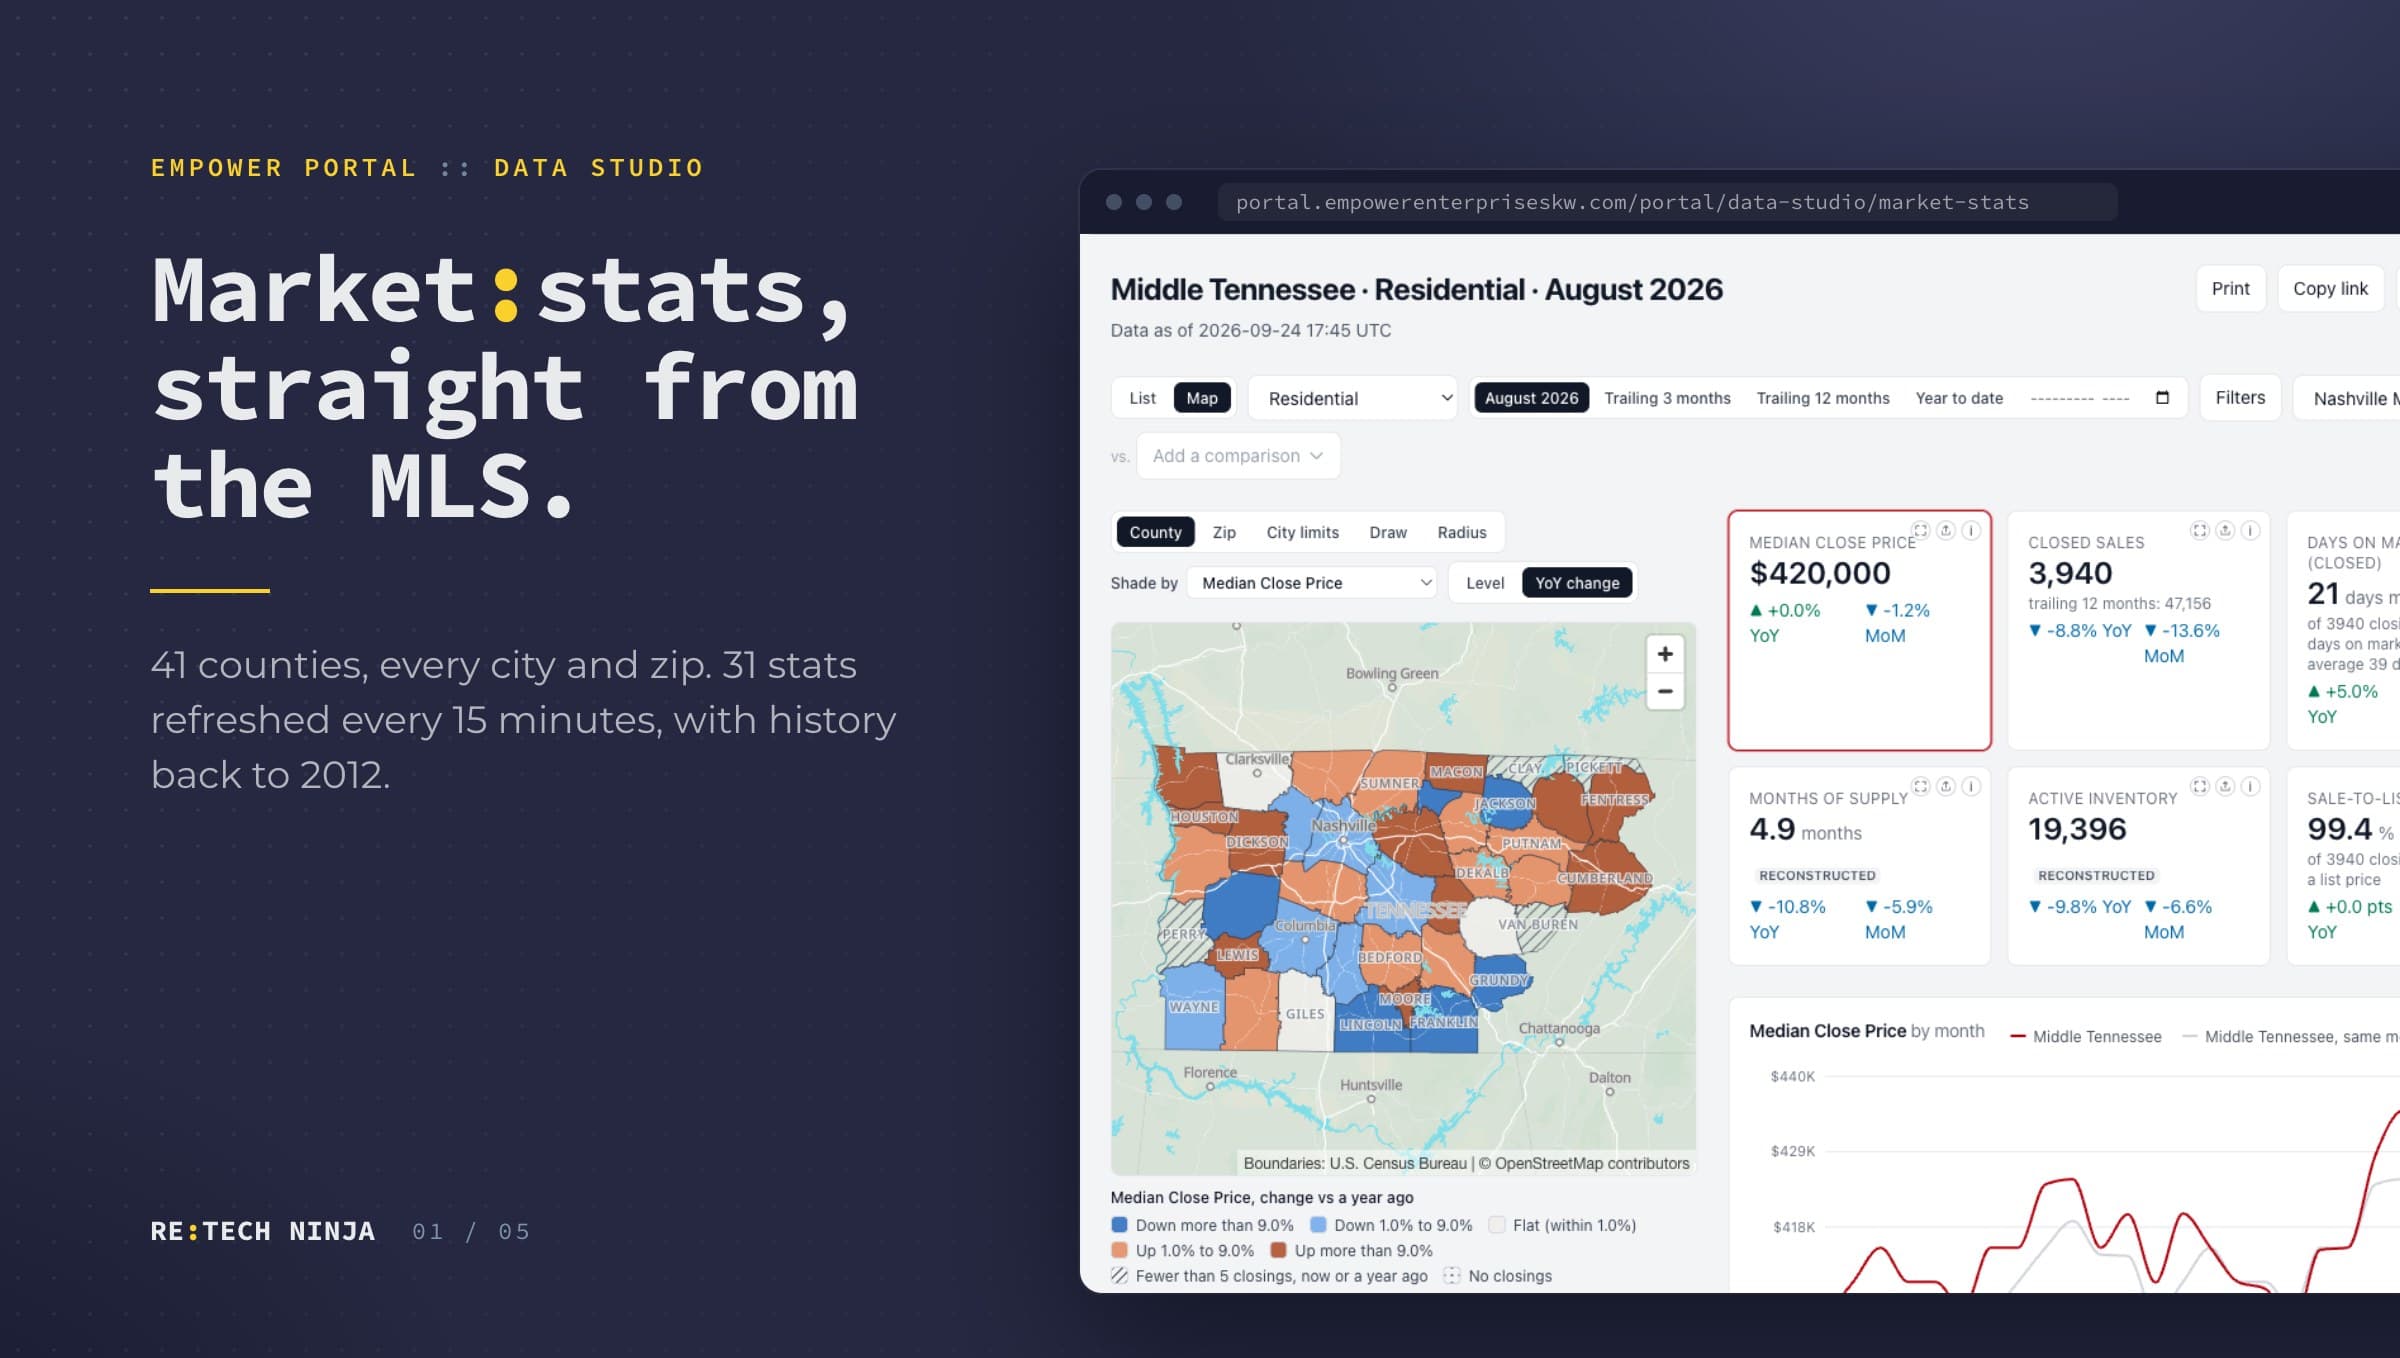
Data Studio replicates the full RealTracs feed through MLS Grid into the brokerage's own database and turns it into a place agents actually use. Market Stats shows 31 stats for any county, city, or zip, each with its year-over-year change and the parent area's number beside it. The map shades every county or zip by a stat, as this month's level or as change from a year ago. Draw any shape (your farm) or drop a pin with a radius, and every stat recalculates for exactly that area. City limits come from U.S. Census town lines, not mailing addresses. Our Listings and My Production sit alongside, so agents see the market, their office's inventory, and their own numbers in one place.